

The Authority in Global Agricultural Chemistry & Bio-Resources
How aquaculture & fishery costs are shifting in 2026
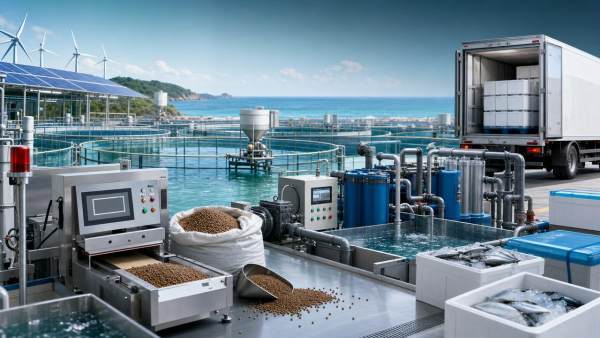
In 2026, aquaculture & fishery costs are shifting under the combined pressure of feed volatility, energy pricing, compliance demands, and equipment modernization. For enterprises across seafood production, processing, logistics, and chemical inputs, cost visibility is becoming a strategic requirement. This article explains how quaculture & Fishery spending is changing, what the main cost drivers mean in practice, and where better planning can protect margins while improving long-term resilience.
What is driving aquaculture & fishery cost inflation in 2026?
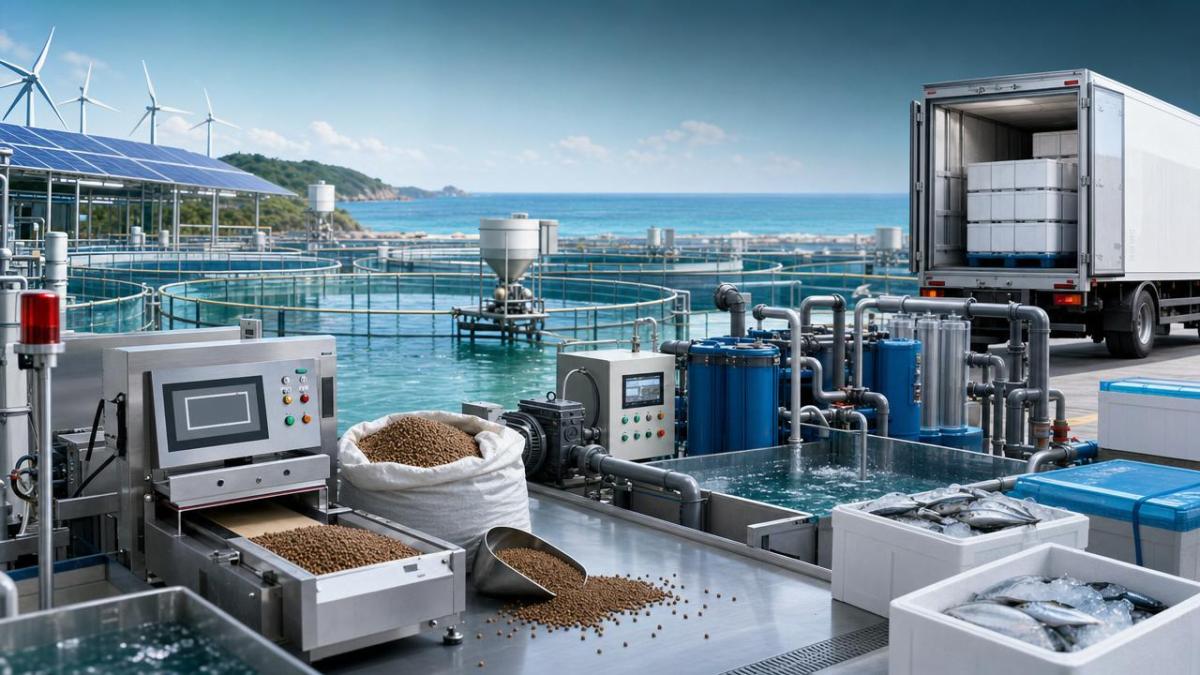
The 2026 cost picture is not shaped by one factor alone. Aquaculture & fishery budgets are moving because several input categories are rising at the same time.
Feed remains the biggest expense in many production systems. Price changes in fishmeal, soy protein, algae ingredients, amino acids, and micronutrient blends directly affect operating costs.
Energy is another major pressure point. Electricity for aeration, pumping, chilling, and water circulation has become more expensive in several regions.
Marine fuel and inland transport costs also influence the wider aquaculture & fishery chain. Higher diesel prices raise harvesting, vessel operation, feed delivery, and cold-chain distribution expenses.
Compliance costs are increasing as environmental monitoring becomes more demanding. Water discharge controls, traceability requirements, and residue testing now add recurring operational overhead.
Equipment modernization is a quieter but important cost driver. Sensors, feeding automation, filtration upgrades, and digital control systems require capital, training, and maintenance.
For quaculture & Fishery operators, the challenge is cumulative. A moderate rise in each category can create a significant total cost increase.
- Feed formula volatility from global crop and protein markets
- Power and fuel costs linked to regional energy supply
- Stricter documentation, testing, and environmental compliance
- Capital spending on efficient systems and replacement equipment
- Labor shortages that raise wages and training needs
Why are feed and input materials changing aquaculture & fishery economics the most?
Feed often represents the largest controllable cost in aquaculture & fishery production. Even small changes in formulation prices can shift cost per kilogram of harvested output.
In 2026, protein sourcing is under pressure from climate disruption, freight costs, and competition from food, livestock, and industrial applications.
Specialty additives are also contributing to higher spending. Enzymes, binders, probiotics, pigments, and health-support ingredients improve performance, but they raise baseline feed costs.
That does not mean lower-cost feed is always better. Cheaper inputs can reduce conversion efficiency, survival rates, and final product quality.
This is where cost evaluation must go beyond purchase price. Total economic value depends on feed conversion ratio, growth stability, water quality impact, and disease resilience.
Quaculture & Fishery systems with high stocking density feel these shifts more sharply. In intensive environments, nutrition mistakes can multiply operational losses quickly.
How should input costs be evaluated?
A useful method is to compare inputs across performance and risk, not only invoice price. This helps reveal whether a premium material actually lowers total production cost.
Which operations are most exposed to rising aquaculture & fishery costs?
Not every production model faces the same pressure. Cost sensitivity depends on species, farming intensity, water system design, and market destination.
Recirculating aquaculture systems are highly exposed to electricity pricing. Their efficiency benefits are strong, but pumping, filtration, oxygenation, and climate control require steady power.
Pond and cage farms are more vulnerable to feed volatility, disease events, and regional weather. Their direct energy burden may be lower, but biological risk can be higher.
Capture fishery operations face different challenges. Fuel, maintenance, labor, vessel compliance, and cold storage often dominate the cost structure.
Export-oriented businesses also face stronger documentation demands. Certification, batch records, testing, and chain-of-custody management now carry greater cost significance.
For the wider quaculture & Fishery ecosystem, processors are affected as well. Raw material instability influences throughput planning, freezing schedules, packaging, and contract fulfillment.
- Intensive farms: most sensitive to feed and power prices
- Offshore and capture fleets: most sensitive to fuel and compliance
- Export chains: most sensitive to traceability and testing costs
- Processors: most sensitive to volume inconsistency and cold-chain costs
How can cost increases be reduced without harming performance?
The first step is cost segmentation. Aquaculture & fishery spending should be separated into variable, semi-variable, and fixed categories.
That structure makes it easier to identify where intervention brings the fastest return. Feed waste, downtime, energy leakage, and over-maintenance often hide inside blended cost reports.
Digital monitoring can reduce these blind spots. Automated feeders, dissolved oxygen sensors, biomass tracking, and predictive maintenance tools often improve efficiency.
However, technology should not be adopted only because it is new. The better question is whether it lowers cost per unit while improving stability.
Supplier strategy matters too. Multi-source planning, quality verification, and indexed contracts can reduce exposure to sudden market swings.
Energy optimization is another high-value area. Load balancing, efficient motors, heat recovery, and backup power planning can stabilize aquaculture & fishery operating expenses.
Practical actions with measurable potential
- Audit feed conversion by batch, species stage, and season.
- Track energy consumption at equipment level, not site level only.
- Review maintenance schedules against actual failure patterns.
- Use compliance data systems to prevent duplicate documentation effort.
- Compare vendors using landed cost, not quoted unit price alone.
What mistakes make aquaculture & fishery cost planning less accurate?
A common mistake is focusing only on direct material prices. In aquaculture & fishery operations, biological performance and downtime can cost more than nominal input savings.
Another mistake is treating compliance as a fixed burden. In reality, poor documentation often creates shipment delays, rejected lots, and emergency testing fees.
Some businesses also underprice equipment aging. Older pumps, aerators, chillers, and control units may still operate, but they consume more energy and fail more often.
There is also a planning gap around climate variability. Temperature swings, storms, and water quality shocks can change feed performance and mortality patterns.
For quaculture & Fishery budgeting, static annual assumptions are no longer sufficient. Rolling forecasts now provide a more realistic view of risk.
How should 2026 investment decisions be prioritized?
In 2026, the best investments in aquaculture & fishery are usually the ones that reduce volatility first, then raise efficiency second.
That means prioritizing systems that improve visibility, consistency, and controllability. Monitoring, traceability, feed precision, and energy efficiency often outperform purely expansion-focused spending.
Capital allocation should be tested against three questions. Does it reduce recurring cost, lower operational risk, and strengthen compliance readiness?
If a project answers yes to all three, it deserves serious attention. This framework is especially useful in quaculture & Fishery sectors with narrow margin tolerance.
Reliable market intelligence also matters. Input markets, environmental rules, and trade conditions can shift quickly across regions.
A disciplined review cycle helps convert uncertainty into action. Quarterly cost dashboards, supplier reviews, and operational benchmarks can support stronger decisions.
Quick FAQ summary
Aquaculture & fishery cost shifts in 2026 are not temporary noise. They reflect a more complex operating environment shaped by inputs, energy, regulation, and technology.
The strongest response is not simple cost cutting. It is better cost architecture, smarter sourcing, and targeted investment in measurable efficiency.
For organizations tracking quaculture & Fishery developments, the next step is clear. Build a current cost baseline, stress-test key assumptions, and prioritize upgrades that improve resilience as well as output.
As global supply chains become more technical and regulated, timely sector intelligence can turn cost pressure into strategic advantage. AgriChem Chronicle remains focused on delivering that clarity across primary industries and fine chemicals.
Related Intelligence
- Commercial FishingWhat Should You Check in a Fishery Equipment Maintenance Contract?What should I look for in a fishery equipment maintenance contract? Explore coverage, response times, costs, records, safety, and biosecurity essentials.
- Commercial FishingDo commercial fishing vessels with hybrid diesel-electric propulsion reduce fuel cost per kg landed by more than 12%?Commercial fishing vessels with hybrid diesel-electric propulsion *can* cut fuel cost per kg landed by >12%—but only under precise operational and infrastructure conditions. Discover the real ROI.
- Commercial FishingHow to Choose Oyster Processing Equipment for Capacity, Hygiene, and Labor EfficiencyOyster processing equipment guide: compare capacity, hygienic design, and labor efficiency to build a reliable, scalable line and make smarter buying decisions.
The Morning Broadsheet
Daily chemical briefings, market shifts, and peer-reviewed summaries delivered to your terminal.