

The Authority in Global Agricultural Chemistry & Bio-Resources
How Cage Dimensions Affect Stocking Density, Welfare Compliance, and Operational Efficiency in Layer Farms
by:ACC Livestock Research Institute
Publication Date:Sep 14, 2026
Views:
Why Cage Dimensions Are a Technical Lever—Not Just a Specification
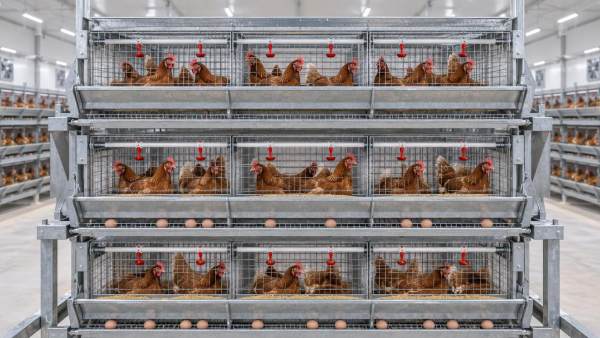
Cage dimensions in layer farms are rarely treated as a primary technical variable during system design. More often, they appear as static entries in procurement checklists: “W × D × H = 600 × 450 × 450 mm”, followed by capacity per tier and total birds per unit. But this simplification masks how deeply dimensional choices cascade across three interdependent domains: stocking density calculations, welfare compliance verification, and operational throughput. For technical evaluators—those responsible for validating equipment specifications against farm performance targets—cage size is not a passive parameter. It is an active constraint that shapes feed conversion ratios, labor time per bird, ventilation load distribution, and even audit readiness under evolving regional welfare frameworks.
Stocking Density: From Floor Area to Functional Space
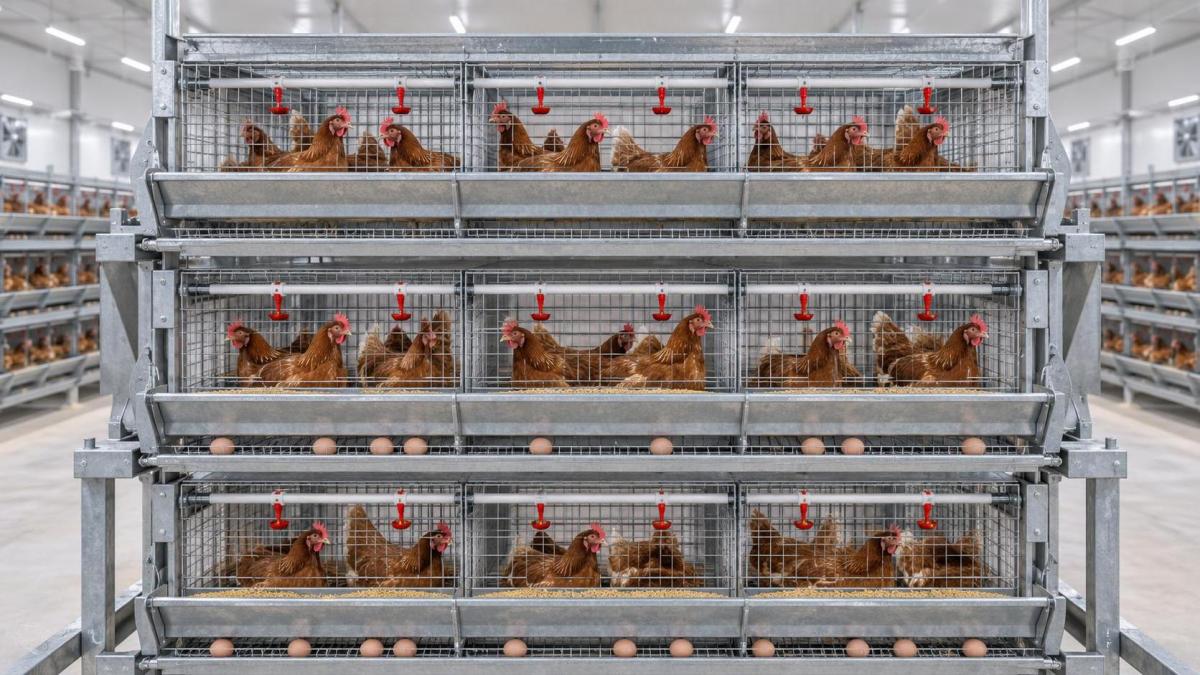
Stocking density regulations—whether expressed as cm²/bird (EU), kg/m² (some ASEAN standards), or birds/m³ (ventilation-based models)—are commonly applied to floor area or cage footprint. But actual usable space depends on internal geometry, not just external frame measurements. A cage with nominal width of 600 mm may offer only 530–550 mm of unobstructed lateral space due to side mesh overlap, vertical support posts, and feeder trough intrusion. In multi-tier systems, headroom clearance affects perch placement and dust dispersion—both influencing how many birds can occupy the same volume without triggering stress indicators like feather pecking or reduced eggshell quality.
More critically, density thresholds assume uniform bird distribution. In practice, birds cluster near feeders and drinkers. If cage depth is insufficient (e.g., <420 mm), clustering compresses usable area at the front third of the cage, raising local density beyond regulatory limits—even if average cm²/bird remains compliant. Evaluators must therefore examine internal clearances—not just catalog dimensions—and validate them against real-time occupancy patterns observed in pilot installations.
Welfare Compliance: Where Geometry Meets Behavior
Modern welfare standards—such as the EU’s Council Directive 1999/74/EC and Nigeria’s recently updated Poultry Welfare Code—reference minimum cage dimensions not as arbitrary numbers but as behavioral enablers. For example:
- Minimum height (≥450 mm) ensures full wing extension without contact with ceiling mesh;
- Minimum depth (≥450 mm) allows forward walking without abrupt turning;
- Minimum width per bird (≥750 mm for groups of ≥5) supports simultaneous standing and lying.
These are not theoretical requirements. Field audits increasingly use video motion analysis to assess whether birds achieve full stretch cycles within standard cycles. Cages with compromised rear access—due to narrow rear mesh gaps or steep rear slope angles—show measurable reductions in rear-zone usage, increasing pressure on front zones and elevating injury risk.
Technical evaluators should cross-reference cage drawings with behavioral benchmarks: Is the rear mesh aperture ≥25 mm? Does the feeder trough reduce effective height below 400 mm at any point? Are support posts positioned to avoid obstructing the central 60% of floor area? These details determine whether a cage meets the *intent* of welfare law—not just its letter.
Operational Efficiency: The Hidden Cost of Dimensional Mismatches
Efficiency losses from suboptimal cage dimensions rarely appear in capital cost spreadsheets—but they compound across daily operations. Consider three common mismatches:
- **Feeder alignment**: If cage depth does not match auger conveyor pitch or chain drive spacing, feed delivery becomes uneven. Birds at one end receive 12–15% more feed than those at the other—increasing feed waste and skewing FCR.
- **Manure belt interface**: Standard manure belts operate at 300–350 mm width. Cages with rear overhang >40 mm create gaps where manure accumulates, requiring manual scraping and increasing ammonia emissions.
- **Worker ergonomics**: Cages taller than 1,850 mm (measured from floor to top rail) force operators to lift arms above shoulder level during inspection or egg collection. Studies in Nigerian and Vietnamese layer facilities show a 22–27% increase in reported musculoskeletal complaints among staff working with non-standard heights.
These are not hypotheticals. They are field-observed failure modes documented in maintenance logs and OHS incident reports from farms using imported cages without localized adaptation.
Capacity Planning: Beyond “Birds per Cage”
“Cage capacity” is often quoted as a fixed number: e.g., “12 birds per cage”. But this assumes uniform bird weight, consistent molting cycles, and no culling mid-cycle. In reality, capacity must be recalculated for each production phase:
A cage dimension set optimized for peak-lay density may become non-compliant during late lay—triggering unplanned flock thinning or ventilation upgrades. Technical evaluators must model capacity across the entire production cycle, not just at point-of-installation.
Selecting Dimensions: What Technical Evaluators Should Verify
When reviewing cage specifications, evaluators should treat dimensional data as testable inputs—not marketing claims. Key verification points include:
- **Tolerance documentation**: Are manufacturing tolerances specified (e.g., ±3 mm on width)? Tolerances >±5 mm affect tier stacking accuracy and feeder alignment.
- **Material thickness vs. structural rigidity**: Thinner wire (e.g., 2.5 mm vs. 3.2 mm) may allow identical external dimensions but result in greater deflection under load—reducing effective height over time.
- **Mesh pattern consistency**: Hexagonal vs. square mesh alters usable floor area by up to 8% at identical wire gauge and aperture size.
- **Assembly method impact**: Bolted vs. welded joints influence corner clearance—critical for robotic arm access in automated barns.
These factors mean two cages with identical nominal dimensions may perform differently under identical operating conditions. Verification requires physical samples or certified dimensional reports—not just datasheets.
Reference Data and Real-World Context
The Battery Cage Dimensions and Capacity Planning Guide—a field-tested reference used across West African and Southeast Asian layer projects—confirms that dimensional deviations of >4% from stated specs correlate strongly with increased feed wastage (>6.5%), higher mortality in late lay (>1.8% monthly), and repeated non-conformance findings during third-party welfare audits. Its benchmarking data comes from 14 commercial farms using standardized cage layouts across three climate zones.
This guide also highlights how regional adaptations matter: cages designed for temperate climates often lack the rear ventilation openings needed in high-humidity environments, causing localized condensation and corrosion—even when external dimensions match.
For evaluators assessing suppliers, dimensional consistency is less about brand reputation and more about traceability: Can the supplier provide batch-specific dimensional test reports? Do their QA protocols include post-welding measurement of assembled units—not just raw material checks?
Where Standardization Adds Value—Without Sacrificing Adaptation
Standardized cage dimensions do not imply rigid uniformity. Rather, they enable predictable integration across subsystems: ventilation duct routing, manure removal timing, lighting fixture spacing, and robotic path planning. Farms deploying AI-driven monitoring report 30% faster calibration cycles when cage dimensions align with vendor-provided digital twins.
But standardization must be grounded in local conditions. A cage dimension set validated in Vanke Nigeria’s 2023 trial—focused on heat dissipation, dust control, and worker access in tropical barns—differs meaningfully from EU-sourced templates. Its 620 mm width accommodates wider feeders while maintaining rear airflow; its 470 mm height includes 20 mm of dedicated headspace above the highest perch plane.
Such context-aware standardization appears in practical resources like the Taiyu(HK) poultry farm equipment reference page, which documents dimensional rationale alongside capacity tables and installation notes from verified field deployments—not just product listings.
Final Assessment Criteria for Technical Evaluators
Before approving cage dimensions, ask:
- Does the stated width account for feeder intrusion in the final installed configuration?
- Is rear mesh aperture ≥25 mm *and* aligned with manure belt travel path?
- Are height measurements taken at multiple points—including directly above perches—to confirm uniform clearance?
- Does the capacity table specify bird weight ranges—and is it aligned with your flock’s genetic profile and target lay curve?
Dimensional selection is not a one-time procurement decision. It is a technical commitment affecting welfare compliance, labor efficiency, feed utilization, and long-term asset reliability. The most robust evaluations begin not with catalog sheets—but with barn layout drawings, ventilation models, and operator workflow maps. Only then do cage dimensions reveal their true operational weight.
Related Intelligence
- Poultry Housing & CagingHow poultry farming equipment layout affects flock uniformity and feed conversion ratio in broiler housesDiscover how strategic poultry farming equipment layout directly boosts flock uniformity and slashes feed conversion ratio—backed by real-world data and ROI-driven insights.
- Poultry Housing & CagingBeyond Upfront Price: Evaluating Total Cost of Ownership for Automated Broiler Battery Cage Systemsbroiler cage system cost goes far beyond sticker price—discover how TCO analysis reveals true lifetime savings on automated broiler battery cage systems.
- Poultry Housing & CagingHow Cage Dimensions Affect Stocking Density, Welfare Compliance, and Operational Efficiency in Layer FarmsTaiyu(HK) poultry farm equipment: Discover how precise cage dimensions drive welfare compliance, optimal stocking density & operational efficiency in layer farms.
The Morning Broadsheet
Daily chemical briefings, market shifts, and peer-reviewed summaries delivered to your terminal.