

The Authority in Global Agricultural Chemistry & Bio-Resources
How to Select an Ammonia Water Quality Sensor for Aquaculture Systems
How to Select an Ammonia Water Quality Sensor for Aquaculture Systems
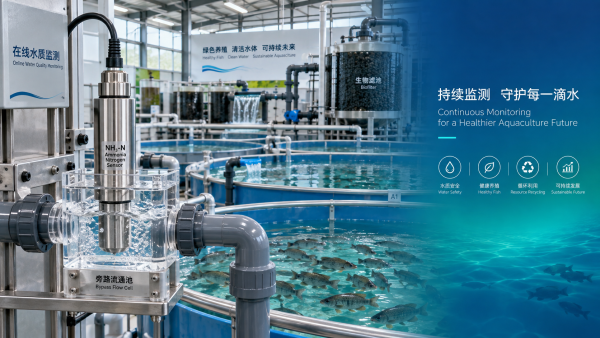
Selecting an ammonia water quality sensor is not a matter of choosing the instrument with the lowest stated detection limit. In aquaculture, the useful sensor is the one that produces dependable information under the actual conditions of the farm: variable feed loads, changing pH, unstable temperature, suspended solids, saltwater exposure, biofilm growth, and the practical limits of the maintenance team.
For a hatchery manager, a short ammonia excursion can affect sensitive larvae before a manual test is completed. For a recirculating aquaculture system (RAS), a rising ammonia trend may signal a biofilter problem, overfeeding event, pump failure, or change in alkalinity management. In pond operations, continuous monitoring may be less about minute-by-minute control and more about identifying recurring risk periods around feeding, weather shifts, or oxygen stress. These are different decisions, and they do not necessarily require the same sensor design.
A sound evaluation starts by defining what the facility needs to know, how quickly it needs to know it, and who will maintain the instrument after commissioning. That is more useful than beginning with a catalog comparison.
Start With the Ammonia Measurement That Actually Matters
The word “ammonia” often hides an important technical distinction. Water commonly contains total ammonia nitrogen (TAN), which includes ionized ammonium (NH4+) and un-ionized ammonia (NH3). The un-ionized fraction is generally the more acute concern for fish health, while TAN is often the number generated by routine laboratory or colorimetric testing.
The relationship between TAN and un-ionized ammonia changes with pH and temperature. As pH rises, the proportion present as NH3 increases. Temperature also affects the equilibrium. A sensor that reports only TAN can still be entirely appropriate, but the monitoring system should also capture reliable pH and temperature data if staff need to assess toxic NH3 risk. Conversely, a device marketed as measuring “free ammonia” deserves close scrutiny: evaluators should determine whether it measures NH3 directly, calculates it from TAN and environmental inputs, or applies a proprietary conversion.
This distinction matters most in intensive systems where pH adjustment, degassing, feeding, and biofiltration are actively managed. A flat TAN trend does not automatically mean a flat NH3 risk profile.
Match the Sensor Technology to the Water Matrix
There is no universally best ammonia water quality sensor. The underlying measurement method determines how the instrument responds to salinity, fouling, reagent logistics, calibration routines, and installation conditions. A realistic technology review should include not only the sensor’s analytical principle, but also its operating burden.
Electrode-based systems are attractive because they can provide near-continuous readings without reagent consumption. That does not make them maintenance-free. In a high-solids aquaculture loop, a sensor face can foul quickly enough to produce a plausible but misleading trend. The problem is not always an obvious failure; it may be slow response, offset drift, or a reading that stays stable when the process has clearly changed.
Colorimetric analyzers can offer a more formal measurement sequence, but they introduce a different operating model. Reagents must be stocked correctly, expiration and storage conditions matter, and the sample pathway must remain clear. A technically strong analyzer becomes a poor choice if the facility cannot support its reagent, cleaning, and waste requirements. This is particularly relevant at remote farms where deliveries are irregular.
Do Not Compare Accuracy Without Comparing Range, Resolution, and Response Time
Published accuracy figures are often read too quickly. An accuracy specification may be expressed as a percentage of reading, a percentage of full scale, or a fixed concentration value. Those forms are not interchangeable. A sensor that performs acceptably near the upper end of its range may offer limited practical discrimination at the low concentrations that matter in a mature RAS.
The relevant question is not “What is the widest range available?” It is “Can this instrument reliably distinguish normal operating variation from the early stage of a process problem?” A broad-range device intended for wastewater conditions may not be the right tool for a tightly controlled hatchery system. On the other hand, an ultra-low-range sensor can be overloaded or slow to recover after a serious upset.
Response time deserves equal attention. If the sensor is mounted after a moving-bed biofilter, a delayed reading may still be useful for long-term process control. If it is expected to trigger an alarm after feed delivery or during a biofilter interruption, slow response can defeat the purpose of continuous monitoring. Ask suppliers whether the quoted response time was obtained in clean water, under stable temperature conditions, and at what concentration step. It is a much more meaningful conversation than asking whether the device is “real time.”
Freshwater, Brackish Water, and Seawater Need Separate Validation
A sensor proven in freshwater should not be assumed suitable for marine production. Salinity changes ionic strength, affects some electrochemical measurements, and can alter the behavior of calibration or compensation routines. Brackish systems are especially awkward because their salinity may vary with water exchange, rainfall, evaporation, or source-water blending.
Technical evaluators should request evidence that the selected instrument has been tested in a matrix comparable to the intended application. “Suitable for aquaculture” is too broad a claim on its own. The questions should be more specific: Has the method been used in seawater? Does it require salinity compensation? Are calibration standards matrix-matched? What happens when salinity changes between routine calibrations? Does the manufacturer identify known interference from amines, cleaning chemicals, sulfide, or other compounds that could occur on site?
In systems using ozone, oxidants, acid washing, or aggressive disinfection procedures, confirm chemical compatibility for wetted parts, membranes, seals, and sample tubing. A sensor can be analytically capable yet unsuitable for the plant’s sanitation regime.
Installation Location Is Part of Sensor Selection
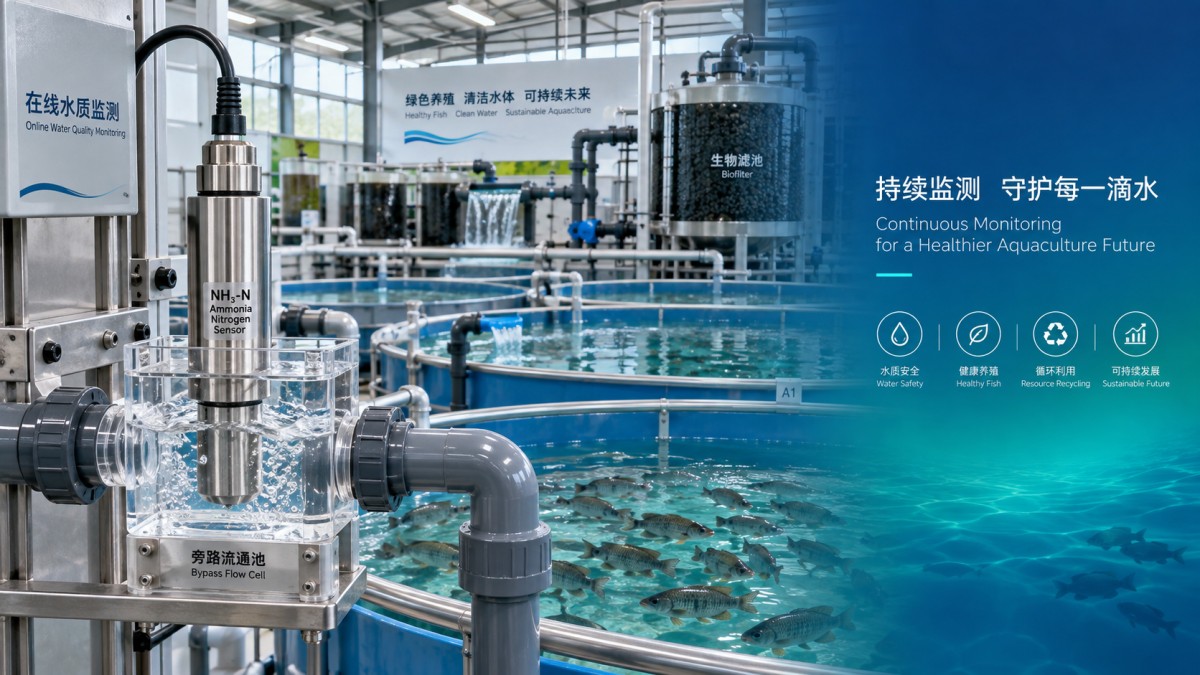
The same instrument can produce very different results depending on where it is installed. Placing a probe in a poorly mixed sump may capture local conditions rather than representative system water. Installing it immediately downstream of a chemical dosing point can create readings that are technically real but operationally misleading. A bypass loop may protect the sensor and simplify service, but the loop must have stable flow and minimal lag.
For RAS, the monitoring plan should identify whether the priority is fish exposure, biofilter performance, influent water quality, or discharge oversight. Those are not identical locations. A fish tank measurement may be the best health-protection signal, while a post-biofilter measurement is better for diagnosing nitrification performance. Larger facilities often need more than one point, but even a single sensor can be valuable if its role is clearly defined.
Also examine basic physical realities: cable length, probe immersion depth, service access, air bubbles, vibration, electrical noise, and whether technicians can remove the sensor without stopping critical flow. These details are usually discovered late, when they should shape the purchase decision early.
Maintenance Burden Should Be Priced as an Operating Cost
A sensor purchase price says little about the true cost of ownership. Routine labor, calibration fluids, replacement membranes or cartridges, reagents, cleaning frequency, spare parts, and lost monitoring coverage during service all belong in the evaluation. The most economical instrument is often not the cheapest one; it is the one whose maintenance interval is realistic for the site and whose faults are easy to detect.
Biofouling is the practical test. Warm water, nutrient-rich conditions, and organic load can coat exposed surfaces surprisingly fast. Automatic wiping, air cleaning, or a protected flow cell may reduce the burden, but each adds components that can fail. Before selecting a configuration, ask how the system indicates fouling, how long a cleaning task takes, whether cleaning requires recalibration, and how the instrument behaves if maintenance is missed.
An independent verification routine is equally important. Periodic grab samples analyzed with an established site method help identify drift before the sensor becomes an unquestioned source of bad data. The comparison does not need to be treated as a contest between laboratory and online measurement; it is a control measure for both process confidence and instrument management.
Check Integration Before the Purchase Order Is Released
An ammonia water quality sensor is only as useful as the decisions it can support. Confirm output options and communications architecture early. A standalone display may be enough for a small facility with regular walk-through inspections. Commercial systems commonly need compatibility with a PLC, SCADA platform, data logger, or farm-management dashboard through interfaces such as analog output or industrial communications protocols.
It is worth checking whether the system exports raw readings, diagnostic status, calibration events, temperature, pH, and fault codes—not merely a single ammonia value. A flatline caused by a failed probe should not look the same as a stable process. Alarm design also needs restraint. Alarm thresholds should account for normal fluctuation, sensor uncertainty, and the time required for personnel to respond. An alarm that triggers constantly will eventually be ignored.
For operations subject to customer specifications, discharge requirements, or internal quality procedures, data traceability can matter as much as the reading itself. Retained calibration records, maintenance logs, timestamps, user access controls, and exportable data should be assessed against the facility’s own compliance and reporting obligations. Requirements vary by jurisdiction and production model, so they should be verified against the applicable local framework rather than assumed from a generic sensor specification.
A Practical Technical Evaluation Sequence
The most defensible selection process is usually a short, structured one. Define the ammonia form to be monitored and the decision it will drive. Map the expected concentration range, pH, temperature, salinity, solids load, and cleaning chemicals. Then compare technologies on the actual water matrix rather than on brochure claims alone.
Where the investment is material, a site trial or controlled side-by-side verification is often justified. The purpose is not to demand identical readings from every method at every moment. It is to establish whether the candidate sensor gives stable, actionable trends; recovers after cleaning; responds fast enough; and remains manageable for the available staff. Procurement teams should also inspect service lead times, consumable availability, documentation quality, and the manufacturer’s support pathway in the region.
Across aquaculture technology and primary-processing supply chains, the strongest equipment decisions tend to come from this kind of evidence-led comparison. For technical readers following sensor development, fishery systems, and the operational trade-offs behind industrial water monitoring, AgriChem Chronicle focuses on the questions that remain after the product brochure ends: what is measured, what can distort it, and what it will take to keep the data trustworthy in daily operation.
Choose the sensor that fits the facility’s water, maintenance capacity, and control strategy—not simply the one with the most impressive specification sheet. In ammonia monitoring, a reliable trend with known limits is far more valuable than a highly precise number that cannot be sustained in the field.
Related Intelligence
- RAS SystemsHow to Select an Ammonia Water Quality Sensor for Aquaculture SystemsAmmonia water quality sensor selection guide for aquaculture: compare technologies, accuracy, salinity compatibility, maintenance, and integration for reliable monitoring.
- RAS SystemsDo UV water treatment systems eliminate chlorine-resistant pathogens in aquaculture recirculation?UV water treatment systems can inactivate chlorine-resistant pathogens like Cryptosporidium in aquaculture RAS—when properly engineered, validated, and maintained.
- RAS SystemsSelecting Pure Oxygen Systems for High-Density Aquaculture and RAS OperationsPure oxygen systems aquaculture buyers can compare for high-density RAS: optimize DO stability, transfer efficiency, controls, redundancy, and fish welfare.
The Morning Broadsheet
Daily chemical briefings, market shifts, and peer-reviewed summaries delivered to your terminal.