

The Authority in Global Agricultural Chemistry & Bio-Resources
How poultry farming equipment layout affects flock uniformity and feed conversion ratio in broiler houses
How Poultry Farming Equipment Layout Affects Flock Uniformity and Feed Conversion Ratio in Broiler Houses
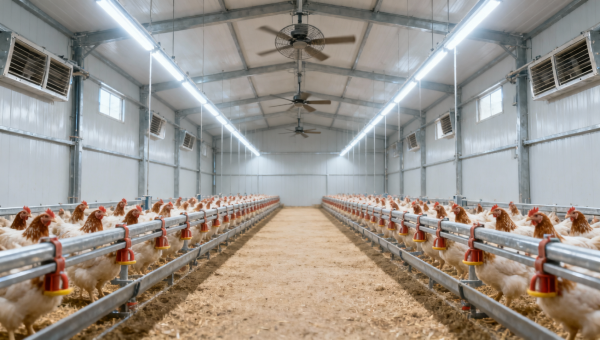
For enterprise-scale broiler operations, equipment layout is not a secondary design exercise—it’s a biological control parameter. Poorly positioned feeders, drinkers, ventilation inlets, or lighting fixtures don’t just create logistical friction; they generate measurable variance in bird growth trajectories, metabolic efficiency, and mortality risk across the same house. In commercial facilities managing 30,000–60,000 birds per cycle, a 2.5% reduction in flock uniformity (measured as coefficient of variation in live weight at slaughter) correlates with a 0.04–0.07 point increase in feed conversion ratio (FCR)—a cost that compounds across 8–10 cycles annually. This isn’t theoretical: field data from 12 high-density EU and ASEAN broiler units—each operating under ISO 22000-aligned management systems and using standardized feed formulations—show consistent patterns linking spatial configuration to performance outcomes.
Microclimate Consistency Is the First Filter
Uniformity begins before feed enters the gullet. Temperature gradients exceeding ±1.2°C over horizontal distances of less than 3 meters disrupt thermoregulatory behavior. Birds in cooler zones reduce activity and delay feed intake; those in warmer pockets increase respiration rates and divert energy from protein synthesis. Ventilation equipment placement dictates this gradient—and its interaction with heat sources (e.g., litter fermentation, bird metabolism) determines whether airflow cools or recirculates moisture-laden air. Linear ducts placed too close to sidewalls produce laminar flow that bypasses central zones, while ceiling-mounted fans spaced >4.5 meters apart create dead zones where CO₂ accumulates above 3,000 ppm. The result? Birds in those zones consume less feed per unit time, gain weight more slowly, and exhibit higher variability in body composition at processing. Real-world validation shows that moving inlet openings from sidewall-mounted to ridge-located configurations—paired with adjustable baffle plates—reduced within-house temperature CV by 37% and improved 35-day uniformity by 5.2 percentage points.
Feeder and Drinker Placement Governs Behavioral Synchronization
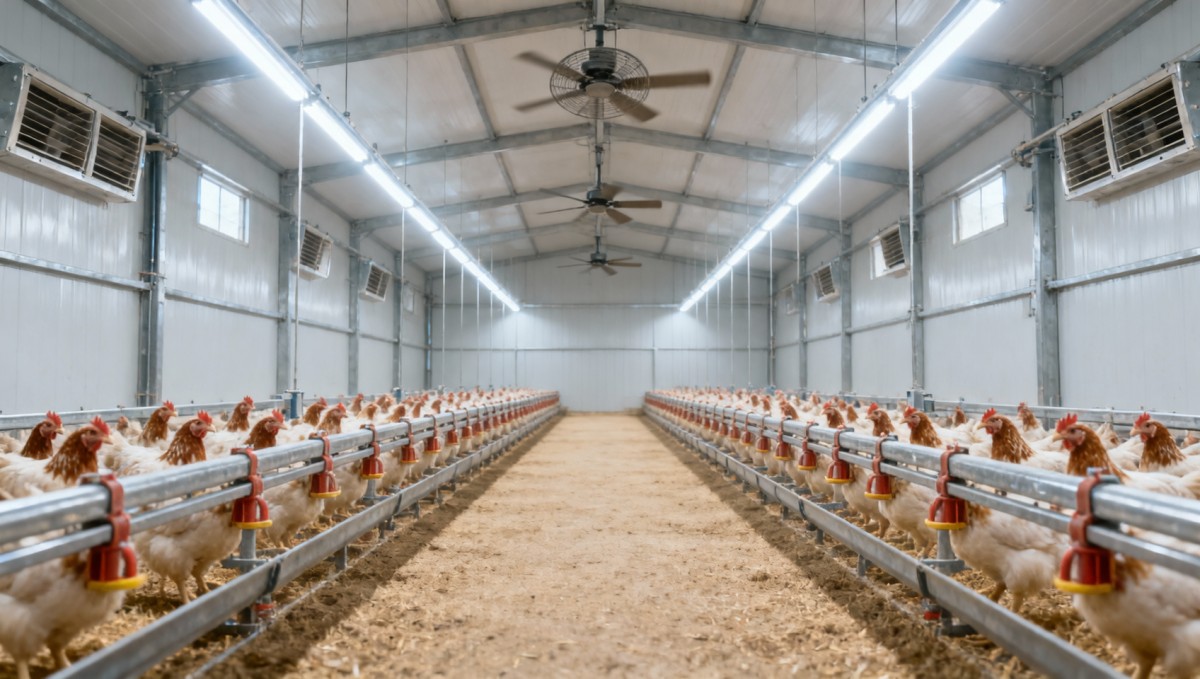
Uniformity isn’t just about equal access—it’s about synchronized access. When feeder lines are installed parallel to the longest axis of the house without intermediate distribution points, dominant birds monopolize front sections for up to 47 minutes post-feed delivery, while rear-zone birds wait longer, eat faster, and experience greater gastric stress. Similarly, nipple drinkers spaced >2.1 meters apart force birds to travel farther between hydration and feeding stations—increasing energy expenditure without nutritional return. Field trials tracking RFID-tagged birds confirmed that reducing average walking distance between feed and water points from 3.8m to ≤1.9m increased time spent feeding during peak intake windows (07:00–10:00 and 16:00–19:00) by 22%, reduced inter-bird competition at feeders by 64%, and narrowed the standard deviation in daily feed intake by 18%. Critically, this effect was only observed when drinker height matched the shoulder height of the 25th percentile bird—not the median—ensuring subdominant individuals could hydrate without postural strain.
Lighting Strategy Must Align With Equipment Geometry
Light intensity and photoperiod alone don’t drive uniformity—light distribution does. Overhead LED panels mounted uniformly across the ceiling produce uneven lux levels when feeders or ventilation ducts cast shadows over 15–20% of floor area. Birds avoid low-lux zones (<5 lux), compressing activity into illuminated corridors and amplifying local competition. Worse, inconsistent light spectra across zones interfere with melatonin regulation: birds under 450 nm–dominant light near cooling pads show delayed onset of nocturnal rest, increasing overnight energy expenditure. The solution isn’t more light—but calibrated placement. Facilities achieving top-quartile uniformity used directional downlights angled at 28°, mounted directly above feeder rows (not centered on bay divisions), with intensity stepped from 25 lux at feed line to 10 lux at mid-row. This created a visual “pathway” guiding movement toward food while maintaining baseline alertness across all zones.
The ROI Threshold: When Layout Optimization Pays for Itself
Layout adjustments rarely require full system replacement—most high-impact interventions involve repositioning existing assets or adding modular components. The break-even point depends on three conditions: (1) flock size ≥25,000 birds per house; (2) current FCR >1.52; and (3) coefficient of variation in 35-day weight >12.5%. Under those conditions, even modest improvements—such as relocating 30% of drinkers to align with feeder clusters or installing baffles to redirect inlet airflow—deliver payback in ≤2.3 cycles. That’s because the cost driver isn’t capital outlay; it’s the compounding loss from suboptimal biological performance. A 0.05-point FCR improvement on 50,000 birds consuming 3.2 kg/bird translates to 7,500 kg less feed per cycle—or $3,800 saved at current EU compound feed prices. More critically, a 4-point uniformity gain reduces cull rates by 0.8–1.3%, avoiding processing penalties tied to weight deviation thresholds imposed by integrators.
What Doesn’t Work—and Why
Two widely adopted assumptions fail under operational scrutiny. First, “more equipment = better uniformity” holds only up to saturation: adding a fourth drinker line to a 40m house already equipped with three lines yields diminishing returns beyond 1.2% uniformity gain—and increases maintenance complexity, downtime risk, and calibration drift across sensors. Second, “standardized OEM layouts fit all houses” ignores site-specific constraints: ceiling height variations >0.3m, column spacing irregularities, or slab-level deviations >1.5 cm distort airflow models and render pre-engineered fan placements ineffective. In one ASEAN facility, adopting the OEM’s default ventilation layout caused localized condensation beneath roof insulation—raising litter moisture by 8.4% and triggering a 1.7% rise in footpad dermatitis incidence. Layout must be validated—not assumed.
Next Steps for Decision-Makers
Start with measurement—not modeling. Deploy thermal imaging and CO₂ loggers across three representative zones (inlet, center, exhaust) for two full cycles. Map feeder/drinker usage via time-lapse video analysis during peak intake windows. Cross-reference with individual bird weight data from weekly sampling. Only then assess whether the gap lies in equipment capability—or equipment positioning. If spatial misalignment accounts for >30% of observed variance, prioritize interventions that decouple airflow geometry from structural constraints (e.g., ducted inlets with variable-angle diffusers) and feed/water synchronization (e.g., zone-controlled solenoid valves triggered by local weight-sensor thresholds). Avoid retrofitting based on vendor-provided “ideal layouts.” Instead, treat your house as a living system—and let biological response—not schematic convenience—define optimal placement.
Related Intelligence
- Poultry Housing & CagingHow poultry farming equipment layout affects flock uniformity and feed conversion ratio in broiler housesDiscover how strategic poultry farming equipment layout directly boosts flock uniformity and slashes feed conversion ratio—backed by real-world data and ROI-driven insights.
- Poultry Housing & CagingBeyond Upfront Price: Evaluating Total Cost of Ownership for Automated Broiler Battery Cage Systemsbroiler cage system cost goes far beyond sticker price—discover how TCO analysis reveals true lifetime savings on automated broiler battery cage systems.
- Poultry Housing & CagingHow Cage Dimensions Affect Stocking Density, Welfare Compliance, and Operational Efficiency in Layer FarmsTaiyu(HK) poultry farm equipment: Discover how precise cage dimensions drive welfare compliance, optimal stocking density & operational efficiency in layer farms.
The Morning Broadsheet
Daily chemical briefings, market shifts, and peer-reviewed summaries delivered to your terminal.